
Context:
This project has been particularly difficut due to it’s heavy content and data visualision modules. The design has come to life in an intense 4 day design workshop where I – part of a 3 people team including an iOS developer and project manager – analysed a table-based-system displaying a multitude of parameters aiming to predict inventory needs for an aircraft operating company.
The target group was a particular one: data analysts, 50-60 y/o, who were set in their ways. So getting them on board with accepting a new interface and a new way of displaying the data was challenging.
The design strives to display the fluctuation or stability in the current inventory usage in a graphical way, using data visualisation.
Problem statement – overall scope of the platform
Redesign a forecasting system so that it provides better UX/UI through effective data visualisations and relevant data display. The system must become easy to understand and navigate by new hires and less experienced.
- Provide an interface that will highlight the data points the user most needs in the menu option they are viewing.
- Provide en effective way for the user to compare relevant data points and data sets
- ensure easy access to alerts and note worthy data changes
Current implementation: short description
The current implementation is based on a table system, where the main form of navigation is search fields in each column. It is very similar to an Excel sheet. This makes the tool difficult to use, it can only be used by employees already accustomed to the system, who know it’s ins and out, who know exactly where among for what to search.
Workshop stages
Our start point was getting to know and understand the purpose and functionality of the current product.
Based on this, I would investigate the current process, have a dialog about how the stakeholders are currently using the product and what are their main actions in reaching their task goals.
After understanding their current process, I start outlining rough ideas on how the processes they describe can be highlighted, communicate with them regarding this and see if any important functions are being buried or disregarded.
This is a tedious step, as the stakeholders can be set in their ways and have difficulty in seeing the benefit of optimisation.
I tackle this through questions, finding out why precisely the presented ideas are not optimal for them.
Often enough the stakeholders realise that the solution to their problem is already included in the outlined idea/functionality or we end up adding to it in order to provide the necessary functions.
I usually use a user story structure to support our requirement definition process: “As a user I want to … so that I can …”. Here I focus on the reason in order to ensure revanche in functionality and not overcrowd the product.
After establishing these guidelines, there is a period of quiet-design-time, after which we meet up in a second phase of the workshop, present the work and gather feedback.
After this, the parties are more or less aligned on the requirements and expectations of the project, and the design phase can go on until a prototype is in place.
The design
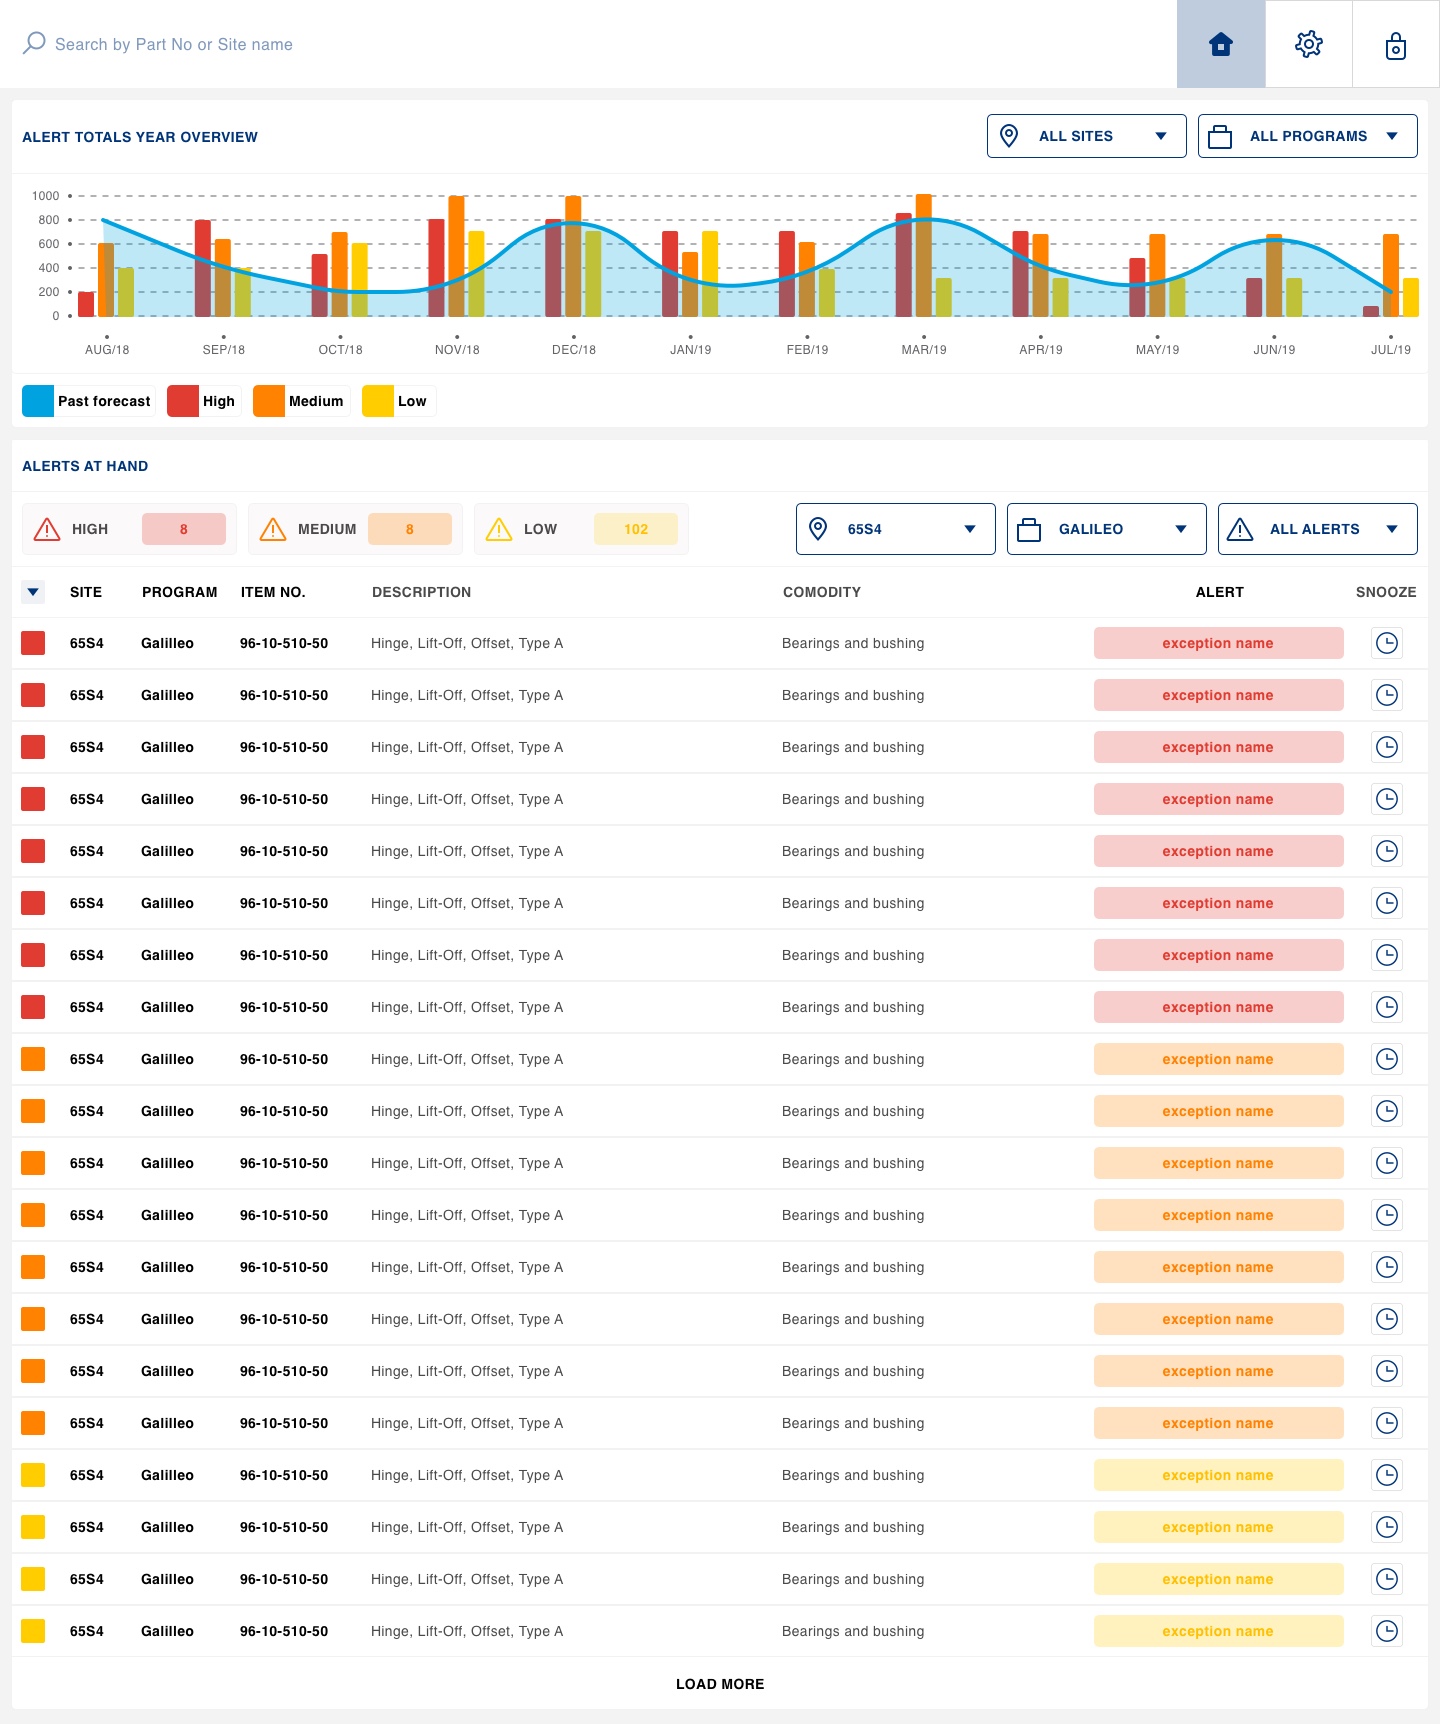
Dashboard – presenting priority information in a structured way
In the workshop, there was clearly explained that the most attention is given to parts low in stock.
What was needed was to inspect the past need, and compare it to the current stock. In this way, the user would be able to asses what actions need to be taken.
Therefore I have:
- created a dashboard view where the focus is on stock decrease
- broke it down into statuses: “high”, “medium” and “low”, with a 4th status (in stock) not displayed as it required no attention. It is purely a value for implementation, to be able to know what value should trigger alerts.
- provided quick actions for each alert for a fluid UX, allowing the user to handle tasks while still having an overview
- added filters to support the user in focusing on interest areas
- created a graphical representation of the yearly progress which is displayed for high level users, that require a larger overview.


The design
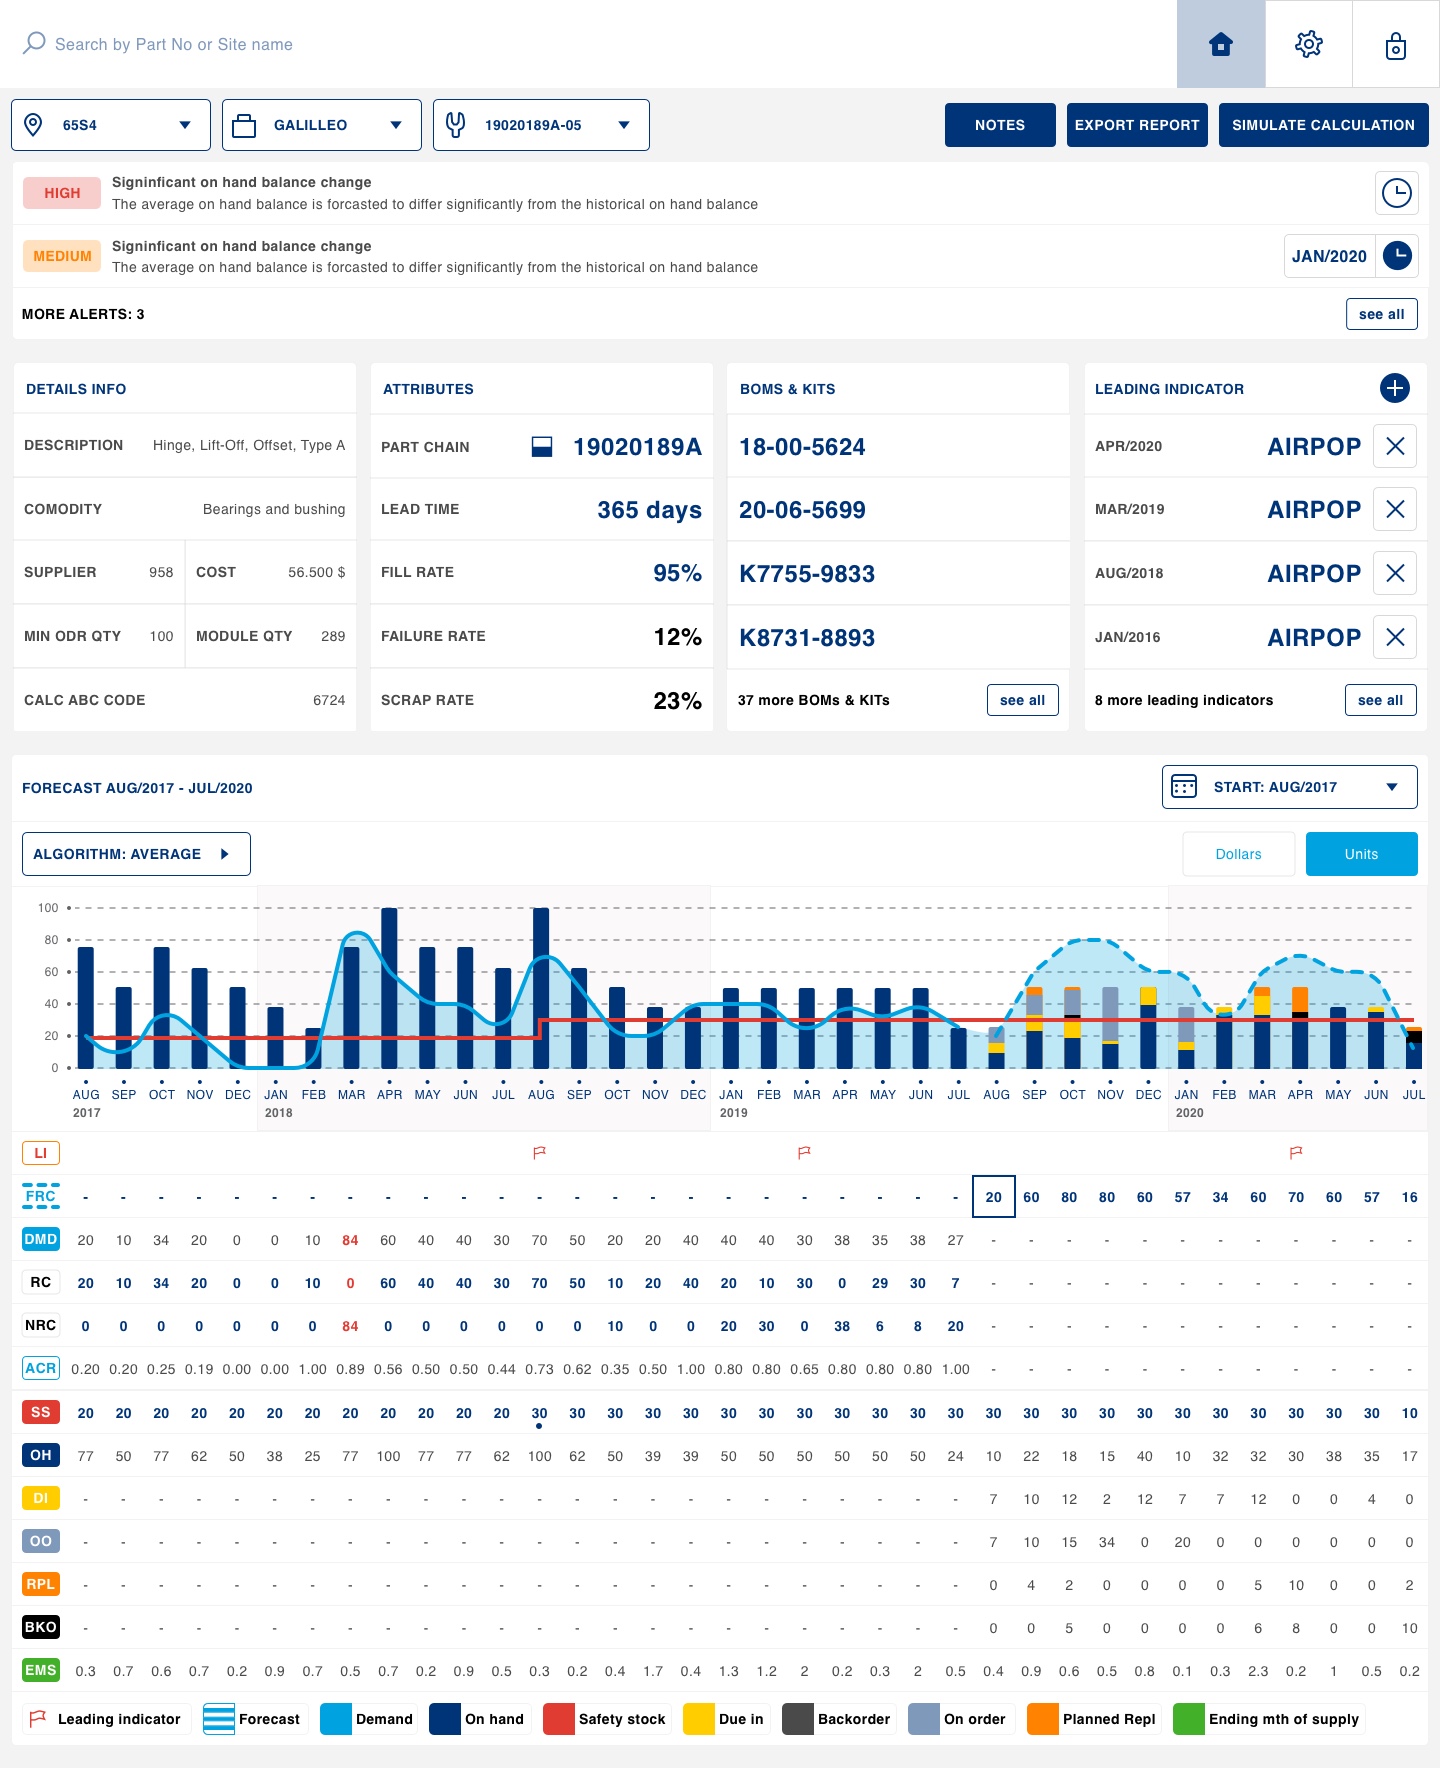
Part inspection – the details, history, future and alerts of a part
During the workshop, the stakeholders – who were also the main users in this scenario – were very concerned with not being able to see all the data they needed to at the same, reason for which they also displayed all the data in columns on one screen (including a horizontal scroll bar).
There were 2 points that I have gathered:
- see the alert for a part
- see the history and forecast of a multitude of parameters for a part
Therefore I have:
- designed a quick filtering function at the top of the screen, allowing them to select the desired part
- displayed the (max) 2 most recent alerts as the top elements on the screen, with quick snooze/resolve actions
- structured the general part info in panels so the user can quickly glance at them if needed and move on.
- displayed the most recent and forecasted part data in a chart, where the user can easily see a trend and inspect peek points.
- designed the bar graphs to represent the stock of the part, with different actions taken on it: delayed, stored, in use, etc. I colour coded the segment for each action and stacked them together so that they show the total stock and the state of the stock.
- added navigation back in history through the graph and a date section function.
- added supporting numerical data underneath the chart for each data set to facilitate easy inspection of peaks and trends and support users who are less visual.
The design
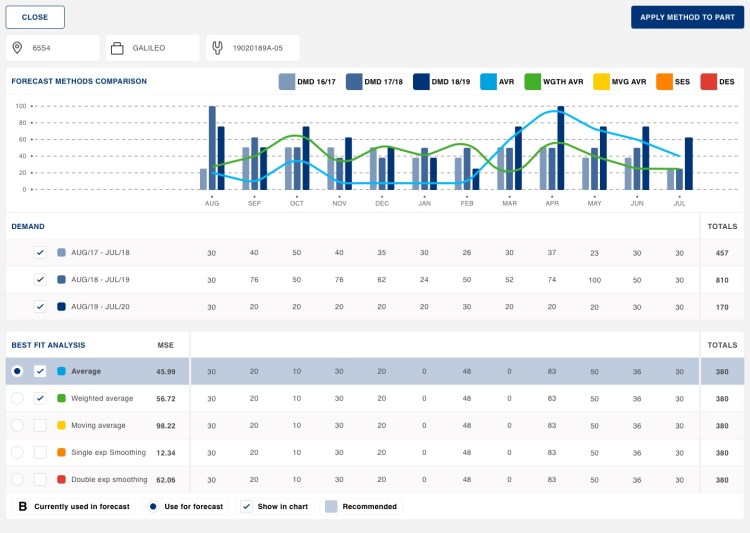
Forecast history and future
One of the main uses of the tool is inspecting the system calculated forecast, indicating the future needed part stock.
This was displayed in a long horizontal table showing the value for each parameter, for each month, for the last 3 years and 1 year into the future.
What I have decided for the design was:
- showing the forecast under the form of a chart: this supports the user in seeing trends and spikes, as the other screens also describe
- for each of the 4 years displayed, I am using the same X axis, where each month shows each of the 4 values.
- the first 3 years are bars, as they are concrete and proven values
- the 4th year – the prediction year – is shown as a line chart, as it is more volatile
- the prediction year has more data points, displayed under the chart, colour coded
- The design shows an interactive chart, where the user has the freedom to select what data sets are to be displayed. reading charts can prove difficult if they are too crowded, and can differ form case to case and user to user. The design is flexible;e and user centred.
- Keeping consistency through the product’s UX, the data sets’ numerical values are dispelled under the chart in this case as well
Mockups

Your message has been sent

